Understanding BigQuery Costs
In this article you will learn what drives BigQuery costs and I will show a SaaS solution that can help you analyze the costs instantly!
Working as a consultant I have had the opportunity to work with several clients that are using Google BigQuery. What all of the clients have in common, is the uncertainty of the cost mechanics in BigQuery. What will the cost be this month? What will the cost be next month? Some of them are just happy because the costs are insignificant compared to the platform cost they just moved away from. Others have billions of rows of data, and a badly written query going into a production pipeline can drive costs significantly, like for example deploying a row by row update script “UPDATE foo set a = b where c = 'the key'” with a frequency of thousands per day on an unpartitioned billion row dataset.
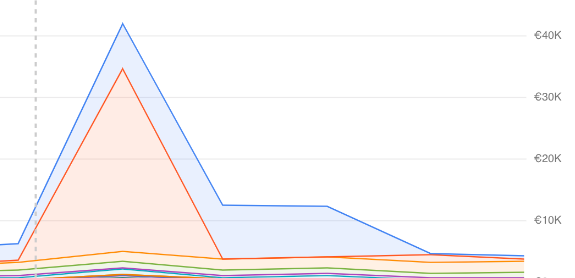
Image — actual incident!
What drives costs?
The single most important factor you need to think about when analyzing costs in BigQuery is the bytes of data you are reading.
- If you are reading more columns than you need you are wasting money, like e.g using the — “SELECT * from ..” anti-pattern. Dont select * ever.
- Have you modeled your data correctly? Is the table aggregated on the correct level? Do you have correct clustering fields? Partitions? Are the consumers using your data as expected? Solving this is not as easy as it sounds, and requires organization level scope.
- If you are reading more rows than needed you are wasting money too. The only way to reduce rows read in BigQuery is to use a PARTITION filter or clustering keys. The SQL LIMIT keyword has no impact on costs at all.
A positive side effect of scanning less data is that your query will execute faster as well! And vice versa, if you are focusing on speed optimizations, you are likely to reduce BigQuery costs as well. It is a win-win.

How it was in the early days of GCP
In the early days of Google Cloud we didn’t really have a (good) way for a customer to drill down into the BigQuery costs. A common way back then was to export BigQuery job logs into BigQuery, and analyze the jobs for insight on cost. This was a time consuming process and would involve significant investment in manpower, because you had to deal with custom IAM roles, setting up log sinks, decoding JSON and figuring out the SQL to write.
BigQuery has made things easier
BigQuery released the INFORMATION_SCHEMA.JOBS_BY_* views a few years ago, and they contain structured job information for every single query, for the past 180 days, that you have been running — either on org, folder or project level. The time to answer questions like “what is my most expensive query?” or “what tables are read most frequently” can now be answered by a simple SQL query. You still, however, have to invest manpower and hours in getting these answered. Every time you ask them! More often than not these magic SQL statements reside in the head of a few specialized individuals in your organization, so governance is basically absent.
Some of our customers have put several hundred hours of work in making awesome custom dashboards giving insight into the above questions. That’s of course great, but… what if you could get the insight without any investment?
A SaaS tool for analytical costs
In Computas, a Google Cloud partner, we saw the common problem for our clients. Instead of our clients spending time and effort into solving this themselves, we took the investment and created a tool for doing just this.
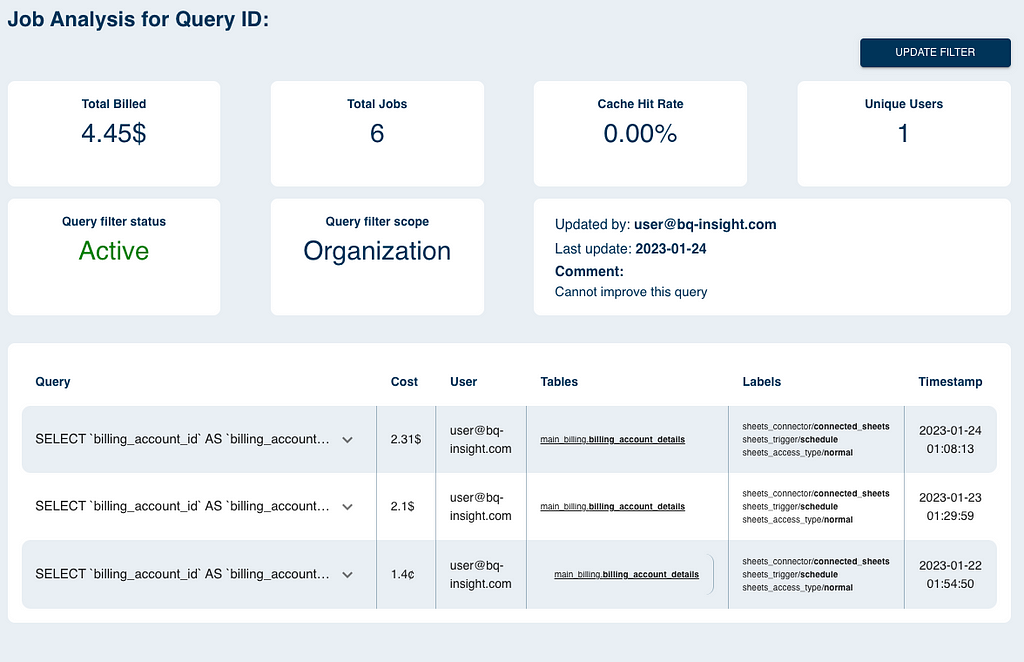
We created a dynamic web page, able to drill down into all aspects of the BigQuery costs, and we called it BID — BigQuery Insight dashboard.
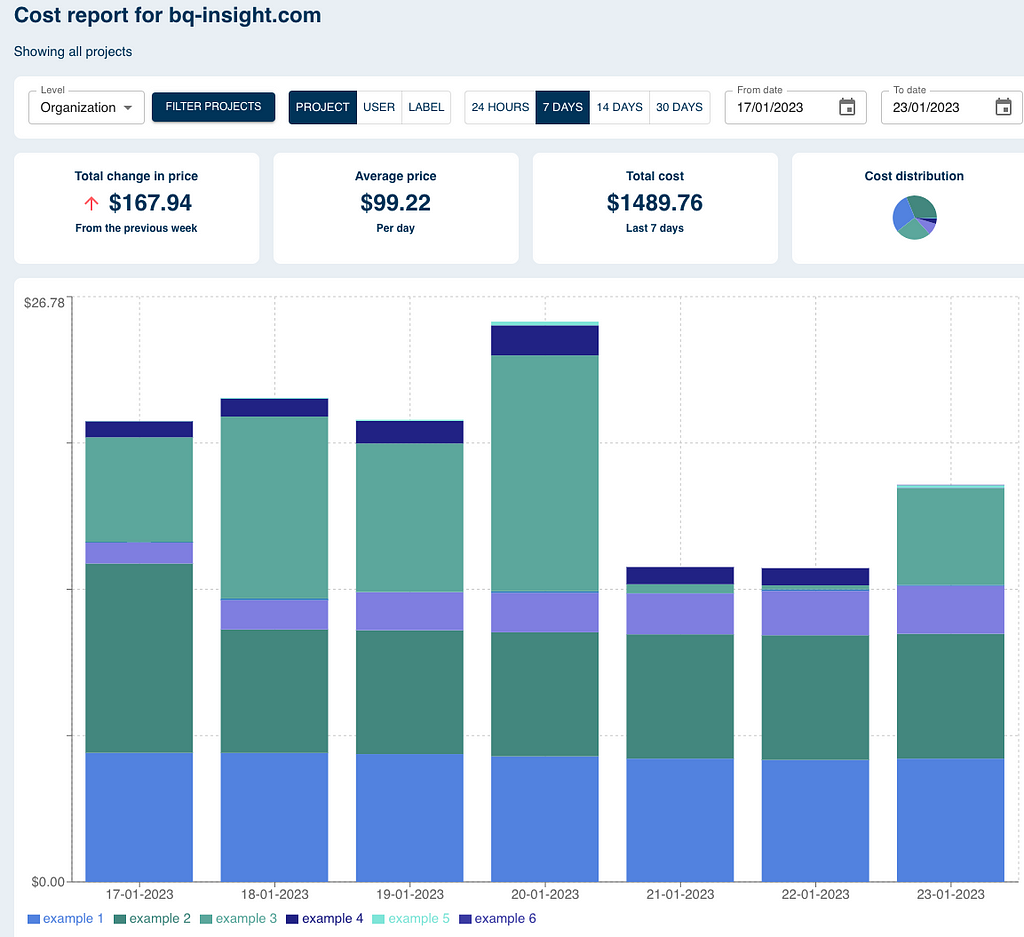
BID gives you instant answers to commonly asked questions, and I am sure you will find some eye openers after spending some time in the tool on what you can do to improve your own BigQuery usage!
A few facts about what the tool can do without any arcane wizardry:
- interactive drill downs on org level,
- cost drill down by project, label, query, user, or table,
- instantly visualize cost in easy to understand graphs,
- compare cost periods.
Once the tool has helped you pinpoint what your biggest problems are, you can let your team start optimize BigQuery usage — or hire experts from Computas to help you 😉
The tool is currently in beta, and has a free trial for any Google Cloud customer out there. It’s definitely worth checking out if you want to optimize your BigQuery data warehouse!
Understanding BigQuery Costs was originally published in Compendium on Medium, where people are continuing the conversation by highlighting and responding to this story.